J Pharm Pharmaceut Sci (www.ualberta.ca/~csps) 5(1):5-11, 2002
Patentees Research and Development Expenditure in Canada
Stephen Li1
Humber College of Applied Arts and Technology, Regulatory Affairs Program, Toronto, Ontario, Canada.Anne Tomalin
CanReg Inc., Dundas, Ontario, Canada.Received January 18, 2002, Revised February 2, 2002, Accepted March 8, 2002
Abstract
Purpose: Many industries are affected by the stale global economy recently. However, the innovative pharmaceutical and biotechnology industry seems to be relentlessly producing a wealth of newer therapeutic products to meet the increasing demand of the aging population. These companies' abilities to produce safer and more effective products are the results of research and development (R&D) spending. Clearly, by investigating R&D expenditures of patentees, one can paint a better picture of the condition in this sector of the Canadian economy.
Methods: To track patentees R&D expenditures, the Patented Medicine Prices Review Board (PMPRB) annual reports have become the primary sources of data. Furthermore, the financial market and the Therapeutic Directorate Annual Drug Submission Performance Report have also been used to address some of the patterns that are seen in PMPRB data.
Results: Most of the data suggest excellent growth in the innovative pharmaceutical and biotechnology sector in Canada. Despite this growth, it still lags behind the demand of newer therapeutic products. Nevertheless, the industry can weather a volatile economy well.
Conclusions: Patentees R&D expenditure is a good indicator of the health in the industry. It provides a perspective not only within Canada itself, but also globally.
Introduction
Advancing science, technology and medicine as well as an aging population are driving up the supply and demand for pharmaceutical and biotechnological innovations in Canada. This undoubtedly will push the number of available therapeutic products to an ever-increasing level. Does this mean the pharmaceutical and biotechnology sectors are booming amid a slowing economy? What is the major expenditure in research and development (R&D) spent on? Where is the major concentration of R&D across Canada? Can Canada be considered an innovative country on an international perspective?
Background
While much of the innovative technology in chemistry, biology and pharmacology research is being developed and carried out in universities and government research centres, it is the innovative pharmaceutical and biotechnology companies that have made a majority of the investments in bringing technology and innovations to the market as therapeutic products.(1) The growth in innovative products will not occur if these products do not bring to the innovators certain forms of rewards. These rewards are only possible with the implementation of patent laws as means of protecting the investments in innovations. Patents are government decrees giving an inventor the exclusive right to produce, use or sell an invention.(2) The billions of dollars that have been committed to R&D by various innovative pharmaceutical and biotechnology companies will not only bring to the public more effective therapeutic products, but the investments will also create jobs in Canada and thereby support the economy.
Generic pharmaceutical companies also innovate in one form or another. However, their innovations are mostly in the form of imitation of products whose patents have expired. Therefore, generic companies do not usually hold many patents if any. On the other hand, credit should be given to generic pharmaceutical companies for offering affordable health care products to the general public. Unlike companies holding patents pertaining to a medicine sold in Canada, generic companies do not have to file R&D data for the calendar year as per the Patented Medicines Regulations if they do not sell any patented product.(3) Therefore, generic companies will not be the scope of this paper.
The Patented Medicine Pricing Review Board (PMPRB) is set up to monitor and to ensure fair pricing by patentees. PMPRB is also required to monitor and report R&D data filed by these companies.(3) Nevertheless, the economics behind patents, R&D and competition are very complex. Indirectly, R&D itself becomes an alternate form of competition, in addition to price competition. This is because R&D costs are fixed costs, unlike material costs, so they are independent of the level of production and the number of units produced.(2) More directly, this means the larger the scale of production, the larger the company, the faster it will recover its R&D costs, the more it will profit and the more likely it will survive. It will suffice for the purpose of this paper to understand that R&D is essential to maintaining profitability and competitiveness for a company. Therefore, by investigating the R&D expenditure of patentees in Canada, it is possible to paint a picture of the innovative pharmaceutical and biotechnology sector more thoroughly.
Analysis
The number of therapeutic products has grown dramatically over the years. In the last decade of the 20th century, companies made a total of 370 new medicines available. This is up from only 239 in the previous decade.(4) Surprisingly, the number of companies with patents in Canada has not grown as much. In fact, Figure 1 shows that the growth of patentees remained relatively flat in the late 1980s.
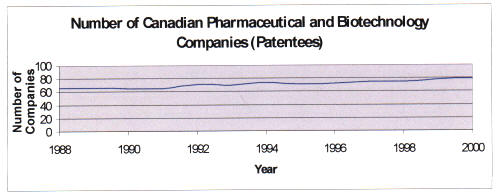
Figure 1: Number of Canadian pharmaceutical and biotechnology companies holding at least one patent. Source: Data obtained from Patented Medicine Prices Review Board Annual Report, 1988-2000.
It has only started to increase slightly beginning in late 1991 to early 1992. This can be explained by the fact that Bill C-91, an amendment to the Patent Act eliminating compulsory licensing, was enacted at that time. This amendment prohibits the routine confiscation of intellectual property.(5) This may have attracted, to some degree, more new patentees. However, the growth is still not dramatic. Does this mean the sector has not grown over the past decade? Not necessarily. This can be attributed to a recent common business practice in this sector - merging. In fact, the fixed costs of R&D as discussed earlier give large firms an advantage. This means that industries like the pharmaceutical and biotechnology in which R&D is important may consist of only a few large firms.
Another way to measure the health of an economy is to look at the financial market. The Toronto Stock Exchange (TSE) 300 Composite performance can be seen as an indicator of the health of the Canadian economy. It encompasses the largest number of Canadian stocks among all other Canadian stock exchange indices, representing almost all of the industries in Canada. Figure 2 (top) shows the performance of the TSE 300 index over the past five-year period.
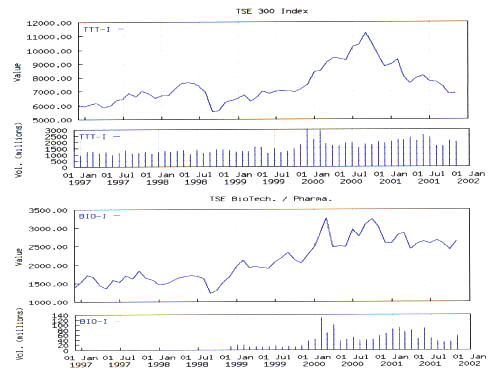
Figure 2: (Top) Performance of the Toronto Stock Exchange (TSE) Composite 300 Index in the past 5 years (monthly). (Bottom) Performance of the TSE Biotechnology and Pharmaceutical sector in the past 5 years (monthly). Source: www.globeinvestor.com
The sudden decline in the Canadian economy is evident in the chart beginning in the late summer of 2000. To assess and to compare the pharmaceutical and biotechnology sector to the overall economy of the same period, Figure 2 (bottom) shows how the sector mirrors the progressive growth in the TSE 300 index during the period of late 1999 to early 2000. However, the sector remained strong throughout the periods of sharp declines in the TSE 300 index. This is an indication that the Canadian pharmaceutical and biotechnology sector is somewhat resistant to a downturn of the economy.
In fact, total sales revenue of patentees has been on a rapid growth over the past 12 years as seen in Figure 3.
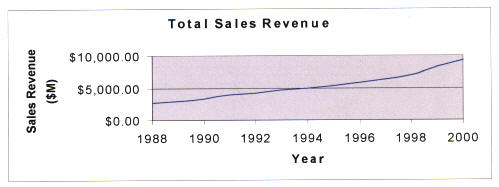
Figure 3: Total sales revenue generated by patentees by selling patented and non-patented products. Source: Data obtained from Patented Medicine Prices Review Board Annual Report, 1988-2000.
This is an indication that the demand for therapeutic products is independent of the state of the economy.
Patentees R&D expenditures as it is illustrated in Figure 4, have also been on a rapid increase over the last 12 years.
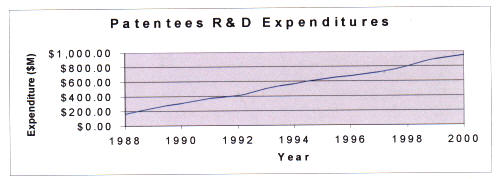
Figure 4: Patentees R&D expenditures that include current expenditures, capital equipment, and allowable depreciable expenses. Source: Data obtained from Patented Medicine Prices Review Board Annual Report, 1988-2000.
Despite a fairly subdued growth in the number of companies, R&D expenditures have been on a dramatic rise over the past decade. It may be tempting to jump to a conclusion that suggests the supply of therapeutic products is also resistant to the Canadian economy. However, it is important to realise that R&D spending increase may be due to the rise of the costs in performing R&D. The complexity of current research in more difficult diseases, higher costs of newer technology and more stringent regulations, which require additional clinical trials, may all contribute to the rise in overall R&D expenditures.(4)
Another possible factor to investigate regarding any potential growth in the sector is to look at the actual average R&D expenditures per company. Figure 5 illustrates how the average R&D expenditure per company is also on the rise, suggesting that this increase is not due to the addition of newer companies.
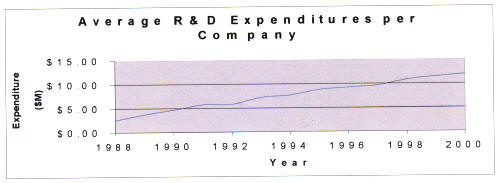
Figure 5: Average R&D expenditures per patentee have grown dramatically over the years. Source: Data obtained from Patented Medicine Prices Review Board Annual Report, 1988-2000.
So, is this an indication of companies investing more in R&D to meet the demand of newer and more effective therapeutic products? Evidently, the rate of R&D expenditure growth is dramatic. Within the past decade, total patentees R&D expenditures have grown more than 300% as shown in Figure 4. Average R&D expenditures per company have also grown at a rate of close to 300% as shown in Figure 5. Ostensibly, this growth suggests growing prosperity in the innovative pharmaceutical and biotechnology sector in Canada. The surprise, however, is the fact that R&D expenditure as a percent of sales has actually flattened out and has actually been decreasing over the past 5 years as shown in Figure 6.
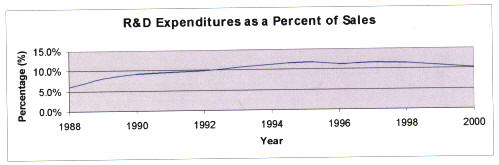
Figure 6: R&D as a percent of sales has been levelling off in recent years. Source: Data obtained from Patented Medicine Prices Review Board Annual Report, 1988-2000.
What do all these mean? Undeniably, R&D expenditures of the pharmaceutical and biotechnology sector in Canada have been strong both financially and in terms of its aggregate cumulative R&D expenditures. But as Figure 6 indicates, patentees seem to have been committing less to R&D spending. Can this be due to the popular trend of merging companies, in which the sector has reached a level where competition no longer exists because the few firms that remain have enough patents to protect them and therefore deter any real competition? Hardly. Competition in this sector is still fierce and that is the reason for the growing trends in merging. It is interesting to note that for the past 12 years, the top 10 patentees in R&D expenditure-to-sales ratio continue to more or less be dominated by the same companies. Table 1 shows that the same four to five companies have remained on the top 10 R&D expenditure-to-sales ratio list for the past decade. Therefore, the decline may be due to the fact that the demand in this sector, as seen in the rapid growth in sales revenue, has outgrown the supply side, as seen in R&D commitment.
Table 1: Annual Top 10 Pharmaceutical & Biotechnology Patentees in R&D Expenditure-to-sales Ratio
1991
Boehringer Ingelheim (Canada) Inc.
Connaught Laboratories Limited
Ferring Inc.
Pharmacia (Canada) Inc.
Solvay Kingswood Inc.
Adria Laboratories of Canada Ltd.
Hoffman-La Roche Limited
Sandoz Canada Inc.
Merck Frosst Canada Inc
Johnson & Johnson Pharm. Companies in Canada
(%)
41.0
24.6
22.7
22.3
19.0
15.3
14.1
12.1
11.6
11.5
1992
RH Pharmaceuticals Inc.
Boehringer Ingelheim (Canada) Inc.
Connaught Laboratories Limited
Amgen Canada Inc.
Solvay Kingswood Inc.
Kabi Pharmacia (Canada) Inc.
Adria Laboratories of Canada Ltd.
Ferring Inc.
Boehringer Mannheim Canada Inc.
Hoffman-La Roche Limited
(%)
52.0
44.8
27.7
24.5
23.7
22.5
19.4
17.6
14.6
14.5
1993
RH Pharmaceuticals Inc.
Amgen Canada Inc.
Boehringer Ingelheim (Canada) Inc.
Connaught Laboratories Limited
Hoffman-La Roche Limited
Ferring Inc.
Boehringer Mannheim Canada Inc.
Wyeth-Ayerst Pharmaceutical Companies
SmithKline Beecham Pharma Inc.
Adria Laboratories of Canada Ltd.
134.0
81.0
39.5
28.4
24.2
18.6
17.0
16.7
16.1
15.9
1994
Cangene Corporation (form. RH Pharm. Inc.)
Amgen Canada Inc.
Connaught Laboratories Limited
Boehringer Ingelheim (Canada) Inc.
Hoffman-La Roche Limited
Boehringer Mannheim Canada Inc.
Wyeth-Ayerst Canada Inc.
Sanofi Winthrop
Warner-Lambert Canada Inc. (Parke-Davis)
Genentech Canada Inc.
176.0
115.0
35.7
33.4
26.9
25.9
21.3
19.0
16.8
16.2
1995
Cangene Corporation
Amgen Canada Inc.
Connaught Laboratories Limited
Boehringer Ingelheim (Canada) Inc.
Procter & Gamble Pharmaceuticals Canada, Inc
Warner-Lambert Canada Inc. (Parke-Davis)
Wyeth-Ayerst Canada Inc.
Hoffman-La Roche Limited
Merck Frosst Canada Inc.
Hoechst Marion Roussel Canada Inc.
159.0
103.2
75.1
37.7
22.2
20.0
16.4
16.3
15.6
15.3
1996
Cangene Corporation
Amgen Canada Inc.
Ligand Pharmaceuticals (Canada)
Pasteur Mérieux Connaught Canada
Boehringer Ingelheim (Canada) Inc.
Fujisawa Canada Inc.
Warner-Lambert Canada Inc. (Parke-Davis)
Allergan Inc.
Hoechst Marion Roussel Canada Inc.
Merck Frosst Canada Inc.
271.5
99.9
98.8
68.8
37.3
17.9
17.6
15.6
15.1
14.4
1997
Cangene Corporation
Amgen Canada Inc.
Pasteur Mérieux Connaught Canada
Ligand Pharmaceuticals (Canada)
Boehringer Ingelheim (Canada) Inc.
Hoechst Marion Roussel Canada Inc.
Eli Lilly Canada Inc.
Fujisawa Canada Inc.
Janssen-Ortho Inc.
Sanofi Winthrop
183.6
79.9
70.0
48.0
46.4
20.9
15.2
14.0
13.6
13.6
1998
Cangene Corporation
Amgen Canada Inc.
Pasteur Mérieux Connaught Canada
Boehringer Ingelheim (Canada) Inc.
Sanofi Winthrop
Hoechst Marion Roussel Canada Inc.
Searle Canada
Draxis Health Inc.
Merck Frosst Canada Inc.
Ligand Pharmaceuticals (Canada)
241.1
69.6
63.8
42.9
36.9
22.3
21.5
15.9
15.8
15.2
1999
NeXstar Pharmaceuticals Inc.
Cangene Corporation
Aventis Pasteur Limited
Amgen Canada
Sanofi-Synthélabo Canada Inc.
Biogen Inc.
Boehringer Ingelheim (Canada) Inc.
Rhône-Poulenc Rorer Canada Inc.
Procter & Gamble Pharmaceuticals Canada, Inc
Du Pont Merck Pharma Inc.
487.4
193.7
66.3
63.4
51.6
45.2
32.8
25.4
17.4
15.1
2000
Gilead Sciences, Inc.
Cangene Corporation
Biogen Inc.
Amgen Canada Inc.
Crystaal Corporation
Agouron Pharmaceuticals Canada Inc.
Aventis Pasteur Limited
Sanofi-Synthélabo Canada Inc.
Boehringer Ingelheim (Canada) Inc.
Axcan Pharma Inc.
433363.0
224.4
105.0
65.7
63.8
58.4
49.3
34.9
25.5
22.7
Source: Data obtained from Patented Medicine Prices Review Board Annual Report, 1988-2000.
One of the possibilities for the supply side in the sector to lag behind the demand side may be due to the more stringent and complex nature of regulatory requirements. This can be a barrier for companies to move forward through the R&D process to commercialisation of their products. As suggested in the 2000 Therapeutic Products Directorate Annual Drug Submission Performance Report, issuance of Notice of Compliance (NOC) over the past four years, from 1997-2000, has decreased while issuance of Notice of Non-Compliance (NON) has been on a dramatic increase.(6) This means that it is taking longer for a company to market and sell their product. Since a patent on any particular product begins at the R&D stage, the longer it takes to begin selling the product, the harder it is for a company to recover the R&D cost. This is because once the patent is over, other companies can equally sell the same product and this will erode the returns of the original innovator.(2) Therefore, an efficient regulatory affairs process is essential and important both at the level of the company as well as the governmental regulatory agencies.
But is this a result of regulatory inefficiencies or are there other factors contributing to the disproportion in the supply and demand growth in the sector? Interestingly, R&D by type spending does suggest that pharmaceutical and biotechnology companies are very committed to R&D. Figure 7 shows the growth in different types of R&D expenditures over the past 12 years. Not only is applied research (pre-clinical, clinical research as well as manufacturing process research) spending the highest, but its growth is also the highest among all types of R&D spending types.
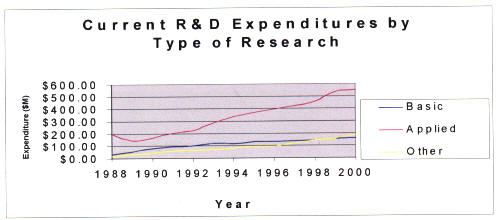
Figure 7: Current R&D expenditures by type of research. Applied research is work for which no immediate practical application is envisaged whereas Applied research is research for which some practical application is intended. Source: Data obtained from Patented Medicine Prices Review Board Annual Report, 1988-2000.
Furthermore, Canada's Research Based Pharmaceutical Companies (Rx&D) made a public commitment that the brand name pharmaceutical industry would increase its annual R&D expenditures as a percentage of sales to 10% by 1996 when the 1987 amendments to the Patent Act was adopted (Bill C-22).(3) As seen in Figure 6, Rx&D reached its target in 1991. Clearly, companies are actively trying to commit more R&D in bringing in more products to the market from their pipelines. It will be interesting to see the R&D expenditure commitment when regulatory affairs become more streamlined and more efficient in the future with the introduction of the Common Technical Document and electronic submissions.
Concentration of R&D Expenditure in Canada
Realising companies are committed to R&D spending in Canada, then where in the country is all the R&D taking place? Indeed, provinces which have the greatest proportion of the Canadian population tend to have the greatest percentage of innovative pharmaceutical and biotechnology R&D expenditures. The assumption is that provinces with more people generally attract more innovative companies to perform R&D. This is because a larger population means there will be more people in the workforce from which companies can choose. Evidently, provinces like Québec and Ontario, which capture most of the Canadian population, have the largest proportion of the total Canadian R&D expenditures by innovative companies.
As shown in Table 2, there is a strong correlation (r greater than or equal to 0.90) between R&D spending and population among all of the provinces and territories in Canada for all of the 12 years that have been analysed. More interesting, however, is the trend of R&D expenditure allocations over the years. Table 2 also shows the amount of R&D spending per person within the population to be increasing very steadily throughout the period. This is suggested by the increasing slopes of the linear regression model in each consecutive year. In other words, innovative companies are committing more and more resources over the same number population through the years. This provincial analysis, therefore, shows the growth of R&D in the sector is strong. It just cannot match the rate of growth in demand of therapeutic products in the market.
Table 2: Statistical Analysis of R&D Expenditures in Canada
1988
y=5.5567x-4946.53
r=0.940641
r2=0.884805
1989
y=7.83602x-7388.41
r=0.961913
r2=0.925276
1990
y=7.69723x-7415.55
r=0.949201
r2=0.900983
1991
y=11.4112x-10893.5
r=0.946011
r2=0.894937
1992
y=12.9993x-11340.6
r=0.90437
r2=0.817885
1993
y=14.7301x-13141.7
r=0.911751
r2=0.831289
1994
y=16.2648x-14370.9
r=0.904881
r2=0.818809
1995
y=17.1654x-15327.8
r=0.914022
r2=0.835436
1996
y=17.4878x-15289.1
r=0.906231
r2=0.821254
1997
y=18.4422x-16115.2
r=0.908246
r2=0.824911
1998
y=19.5209x-16611.1
r=0.897915
r2=0.806251
1999
y=22.0132x-18686.0
r=0.914696
r2=0.836668
2000
y=24.3823x-20773.8
r=0.920353
r2=0.84705
Linear regression statistical data of R&D expenditures versus provincial population for all provinces and territories in Canada. Here, a strong (r greater than or equal to 0.90) correlation every year for the past 13 years indicates that there is a direct positive linear relationship between R&D expenditures and provincial population. In other words, the larger the population, the more R&D expenditures. The magnitude of this relationship is increasing every year as seen by the number in front of the x (i.e. the slope) increasing every year. The r2 value indicates the proportion of data points that can be explained by this model.
Source: Data obtained from Patented Medicine Prices Review Board Annual Report, 1988-2000. Data analysed by TI Interactive software.
An International Perspective
Tax credits are designed in the tax system to spur companies to increase R&D. However, the expenses in R&D eligible for tax credits are sometimes very limited. For example, in the United States (U.S.), all R&D equipment costs, fringe benefits paid to employees engaged in R&D, salaries and benefits of many employees supporting and supervising R&D activities, the percentage of the expenses of research conducted on a contract basis, and expenses for R&D paid by a U.S. company for R&D conducted outside the U.S. are all ineligible for tax credit. In fact, only about 55% of total R&D expenses qualify for tax credits each year in the U.S.(4) In contrast, the Conference Board of Canada concluded in 1999 that Canada maintains the most favourable tax system for R&D of the eleven countries it examined. They include Australia, France, Korea, Mexico, United Kingdom, Japan, Sweden, Italy, Germany, the U.S. and Canada itself.(3)
Table 3 compares Canada-U.S. R&D Tax Credits eligibilities. Does this mean Canada is the leading country in R&D expenditures in the pharmaceutical and biotechnology industry? To put into perspective, U.S. pharmaceutical and biotechnology companies project $30 billion USD on R&D in 2001. This is an increase of 19% over last year's $25.2 billion USD.(4) During the past two decades, the industry's percentage of sales allocated to R&D has jumped from 11.9% in 1980 to 18.5% in 2001. This compares to an annual average of less than 4% for all other industries within the U.S. By comparison, the pharmaceutical and biotechnology industry in Canada spent $0.94 million CAD in 2000, which is an increase of only 5.6% over previous year's $0.89 million CAD. R&D-to-sales percentage in Canada was at 10.1% in 2000 and at an estimated percentage of less than 5% in 1980.
Table 3: Canada-U.S. Comparison of R&D Tax Credits
Canada
United States
Option to defer claim
Option to defer claim write-offs
Total cost of arms length contracted R&D eligible
Only 65 percent of contracted R&D eligible
Equipment costs qualify
Equipment costs do not qualify
Canadian travel costs qualify
Travel costs do not quality
Employee benefits eligible in certain circumstances
Only direct salary eligible
Option to claim tax credits on proxy amount instead of overhead
No proxy amount available
Source: http://www.gov.mb.ca/itm/trade/invest/bus_facts/govt_programs/govt6.html
Clearly, even with the better tax credit incentives in stimulating R&D in Canada, the growth rate in R&D in the pharmaceutical and biotechnology sector is still lower than that of the U.S.(3-4) In fact, the U.S. growth in R&D is the highest in the world. Pharmaceutical R&D expenditures in Europe in 1990, 1995 and 1999 were at 7.871, 10.767 and 15.000 million EURO respectively.(7) This is a growth of almost 37% from 1990 to 1995 and 39% from 1995 to 1999. By comparison, the U.S. has grown at a rate of close to 70% and 99% for the same periods. In summary, despite having an excellent tax credit incentive for R&D, Canada does not have as much growth in the pharmaceutical and biotechnology sector when compared to other leading parts of the world. Most of the R&D in the industry is performed by foreign companies. Nevertheless, there is excellent growth in the sector to support the Canadian economy, but it will not be at the level as seen in the U.S., Europe or even Japan.(8)
Conclusion
R&D expenditure and hence innovation by pharmaceutical and biotechnology companies is part of the reflection of the health in the sector. However, innovation in the industry is very difficult to measure definitively. There are many variables and factors that can contribute to the whole picture. Investigations in the growth in the number of companies in the sector reveal the popular trend of merges and acquisitions in the industry today. The performance of the sector in the financial market over time indicates how it can weather economic downturns well. Exponential growth in total sales revenue of innovative pharmaceutical and biotechnology companies demonstrates the rapidly increasing demand for newer and more effective therapeutic products by the general public. Rising aggregate R&D expenditures suggest the commitment of companies in the industry to supply the demand with more and better products. Increasing average R&D expenditures per company reinforces the fact further that increases in R&D spending is not due to the growth in the number of companies. Most interesting of all, however, is the levelling off in R&D expenditures as a percent of sales. This illustrates that the supply of innovative therapeutic products cannot match the demand for them. Evidence suggests that lack lustre efficiencies in regulatory processes to commercialise products are partially to blame. Furthermore, the top 10 companies in R&D expenditures as a percent of sales have remained to be the same few companies over the past 12 years, reinforcing the idea that the supply side of the sector is lagging behind the demand side. Nevertheless, R&D expenditures by research type shows companies are mainly committed to applied research in hopes of bringing more therapeutic products onto the market. Provincial R&D allocations studies have pointed to the growing patterns of R&D across Canada, and specifically, in regions with the larger proportions of the national population. The Canadian government is also trying to attract more R&D through improved patent laws as well as a very competitive tax credits system. Although Canada has not reached the same level of growth in R&D as U.S., Europe and Japan, which is possibly due to barriers such as inefficiency in regulatory processes, the growth is still promising. Above all, patentees' R&D expenditure in Canada has indirectly painted a picture of the health of the pharmaceutical and biotechnology industry in the country.
Phelps, C. E., Health Economics, Second Edition. Addison-Wesley, New York, USA, 1997.
Stiglitz, J. E., Boadway, R. W., Principles of Microeconomics and the Canadian Economy, Second Edition. W.W. Norton & Company, Inc., New York, USA, 1997.
Patented Medicine Prices Review Board Annual Report, 1988-2000. (All R&D data for Canada are obtained in the PMPRB Annual Reports)
Pharmaceutical Research and Manufacturers of America at www.phrma.org, 2001.
Merck Frosst Canada & Co. at www.merckfrosst.ca, 2001.
Annual Drug Submission Performance Report, Part 3: TPP (BPA & BBR) Overview, Therapeutic Products Programme, 2000.
"Pharmaceutical R&D Expenditure in Europe and the USA" at www.pharma-outsourcing.com, 2001.
Sharp, M. and Patel, Pari, Europe's Pharmaceutical Industry: An Innovation Profile. European Innovation Monitoring System, 1998.
Corresponding Author: Corresponding Author: Stephen Li, Humber College of Applied Arts and Technology, Regulatory Affairs Program, 205 Humber College Boulevard, Toronto, Ontario, Canada. M9W 5L7. stephen.li.a@utoronto.ca
Published by the Canadian Society for Pharmaceutical Sciences.
Copyright © 1998 by the Canadian Society for Pharmaceutical Sciences.
http://www.ualberta.ca/~csps
