Prediction of Plasma Levels of Aminoglycoside Antibiotic in Patients with Severe Illness by Means of an Artificial Neural Network Simulator Manuscript received September 21st, 1998; Reviewed October 21st, 1998; Accepted October 27th 1998. Kenji Nishizawa, Masaaki Hirano Shigeo Yamamura1, Yasunori Momose Akio Kimura, Toru Mochizuki, Yasuhiro Yamamoto Abstract Purpose.The purpose of this work was to predict plasma peak and trough levels of an aminoglycoside antibiotic in patients with severe illness in an intensive care unit by a novel approach. Plasma levels were predicted based on the values of 15 physiological measurements using an artificial neural network (ANN) simulator Method. A data set of 15 physiological measurements for 30 patients was used to develop the model. The ANN structure consisted of three layers: an input layer comprised of 15 processing elements, a hidden layer comprised of 10 processing elements with a sigmoid function as an activation function, and an output layer of two processing elements (peak and trough levels). The weight between neurons was trained according to the delta rule back-propagation of errors algorithm. Predicted values were obtained by "leave-one-out" experiments by both ANN and multiple linear regression analysis (MLRA. Results. The correlation coefficients between observed and predicted values obtained by ANN prediction using standardized data sets were r=0.825 and r=0.854 for peak and trough levels, respectively. The correlation coefficients obtained by MLRA were r=0.037 and r=0.276 for peak and trough levels, respectively. These results indicate that ANN shows better performance in prediction of aminoglycoside plasma levels from patients’ physiological measurements than MLRA. Conclusions. Prediction of plasma levels of antibiotic in patients with severe illness by ANN was superior to the standard statistical method. Standardization of input data was found to be important for better prediction. ANN has some advantages over standard statistical methods, as it can recognize complex relationships in the data.Introduction Many patients hospitalized in an ICU are in serious emergency condition, and they may readily succumb to infections because of compromised immune function. The prognoses are strongly dependent on drug therapy implemented for treatment of contracted infections. The drug dose and dose schedule are considered to be very important in drug therapy for patients with severe illness. Knowledge of the PK and PD parameters is helpful for selecting the initial dosage regimen and subsequent adjustment of drug dosage. However, because the PK and PD characteristics of these patients may be far from the normal physiological condition, it is difficult to predict or to estimate the PK and PD parameters. Therefore, the dosage regimen for patients with severe illness has been determined experimentally. If plasma levels of drugs in these patients could be predicted from selected physiological measures, it would be of great assistance in determining the appropriate dosage regimen.Recently, an ANN simulator has been applied in many fields such as clinical pharmacology ( 1), population PK (2-4), diagnosis (5-6) and pharmaceutical formulation (7-8). An ANN is a powerful tool for the simulation of non-linear phenomena, its use has led to enhanced prediction accuracy, and the models determined by ANN could be of benefit through developments that improve the understanding of global input-output relationships.Corrigan et al., ( 9) applied neural network to predict gentamicin concentration in a general hospital population. Their results indicated that neural networks offered some advantages over traditional dose prediction methods for gentamicin. In the same manner, if the plasma levels of antibiotics in patients with severe illness can be predicted from physiological measurements, it would be helpful for determining the appropriate dosage regimen for these patients. In this study, we tried to predict the plasma levels of animoglicoside antibiotic in patients with severe illness using ANN. A prediction performance of ANN was compared with that of standard statistical method (MLRA). Materials and MethodsMaterials Arbekacin sulfate (ABK) (brand name: Habekacin, Meiji Seika, Japan), an aminoglycoside antibiotic (10), was used. ABK is widely used for MRSA infection in Japan. Clinical Data Physiological measurements were collected for 30 patients who were given ABK for the prevention of MRSA infection in an ICU. 100 mg of ABK was administered by intravenous drip infusion for one hour in each 12 hour period. Blood samples were taken from the patients just after administration (peak level) and just before the next administration (trough level). The concentration of ABK in plasma was determined by a fluorescence polarization immunoassay. The following 15 physiological measurements were collected for each patient (Table I): age, body weight, rectal temperature, mean arterial pressure, heart rate, respiratory rate, arterial pH, serum sodium concentration, serum potassium concentration, serum creatinine concentration, hematocrit, white blood cell count, volume of parenteral fluid, volume of urine and CRP.
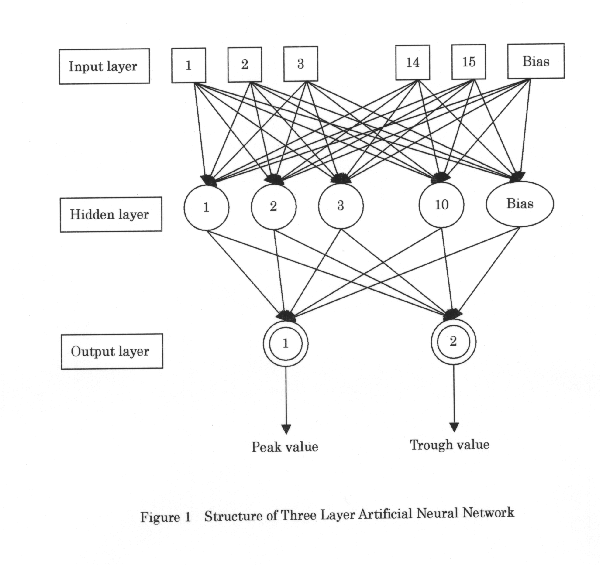
All measurements are considered to influence the PK of the drug, and 10 of the 15 measures mentioned above (except for age, body weight and the last 3 measures) were included as parameters for calculation of the APATCH II score for classification of the severity of disease (11). Since the data were obtained through routine clinical practice, the Institutional Review Board waived the need for informed consent. Where necessary, the data for each physiological measurement were standardized as (observed value - mean) / standard deviation, i.e. standardized data clustered around zero to facilitate modelling by WINNN32 program. ANN Calculation The theory and applications of an ANN have been reviewed elsewhere (12,13). WinNN32 software was used to perform all ANN calculations (14). The ANN used in this model consists of three structural layers: an input layer comprised of 15 processing elements (physiological measurements), a hidden layer comprised of 10 processing elements with a sigmoid function as an activation function, and an output layer comprised of two processing elements (output peak and trough levels). One additional "bias" neuron was incorporated in both the input and hidden layers. The network structure used in the present investigation is shown in Figure 1. The neurons in the hidden and output layers work to calculate the sum of products of input and the weight between connections, according to Eq. 1. The neurons then transfer a value to neurons in the next layer according to an activation function. A sigmoid function (Eq. 2) was used in the present investigation.Figure 1 Structure of Three Layer Artificial Neural Network Input = S (weight*input)+bias weight (1) Output=1/{1+exp(x)=ex(-input)} (2) All weights between neurons in the network were optimized using "error back-propagation learning" (13). The training of the network was stopped when the maximum error between observed and predicted values had decreased to a value less than 0.01. The network had been trained 10 times, each time using new random sets of initial weights. The goodness fit was evaluated by root of mean squared (RMS) error according to Eq. 3. The network with the best fit (the smallest RMS error) was then selected to provide the optimal weights. The peak and trough values were predicted by "leave-one-out" experiments: the network was trained using physiological measurements for 29 patients and the peak and trough values for the remaining one patient were then predicted from the optimized network. Multiple Linear Regression Analysis (MLRA) "Statistica" software (15) was used for multiple regression analysis. The peak and trough values were predicted by "leave-one-out" procedures, similar to the ANN experiments. Results Mean values of 15 physiological measurements and observed plasma levels of ABK in the 30 patients employed in this investigation are summarized in Table I. All patients showed high CRP levels indicating that each of the patients had an acute inflammatory condition. Figure 2 shows the correlation between the observed and predicted plasma levels of ABK as obtained by MLRA. Correlation coefficients were calculated to be r=0.037 and r=0.276 for peak and trough levels, respectively, indicating no correlation between observed and predicted values. This result indicates that the PK of ABK in patients with severe illness could not be predicted from the patients’ physiological measurements by MLRA.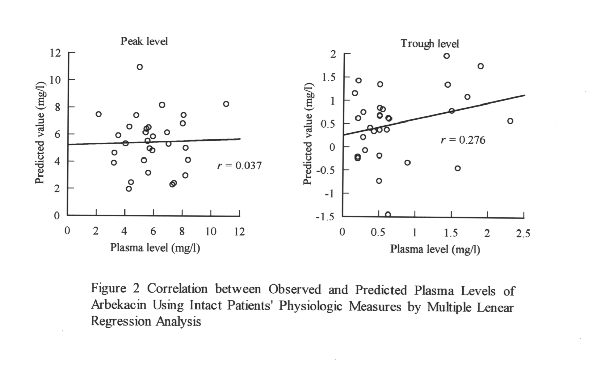
Figure 2 Correlation between Observed and Predicted Plasma Levels of Arbekacin Using Intact Patients' Physiologic Measures by Multiple Linear Regression Analysis Figure 3 shows the correlation between observed and predicted plasma levels of ABK as obtained by ANN prediction using intact (not standardized) data. Correlation coefficients were calculated to be r=0.410 and r=0.635 for peak and trough levels, respectively. 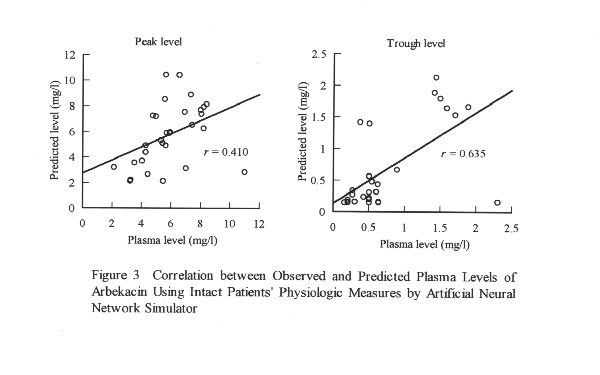
There was a weak correlation between observed and predicted values. The prediction performance of ANN was better than that of MLRA, the precision of prediction, however, was not satisfactory. In order to improve the prediction performance, standardized physiologic measures were used in the ANN prediction (MLRA results using standardized data are the same as those using non-standardized data). The standardization would normalize the error based on the extent of scattering and the order of measures. Figure 4 shows the correlation between observed and predicted values of peak and trough levels. In order to improve the prediction performance, standardized physiological measurements were used in the ANN prediction (MLRA results using standardized data are the same as those using non-standardized data). The standardization would normalize the error based on the extent of scattering and the order of measures. Figure 4 shows the correlation between observed and predicted values of peak and trough levels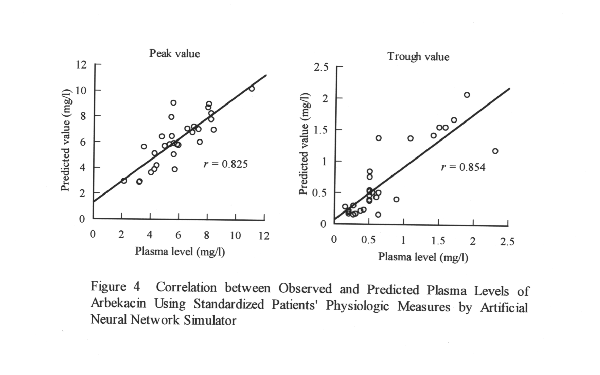
Correlation coefficients were calculated to be r= 0.825 and r=0.854 for peak and trough levels, respectively. Prediction performance using standardized physiological measurements was better than the results obtained using intact physiological measurements. Discussion The performance in prediction of the PK of ABK in patients with severe illness by the standard statistical method, MLRA, was very poor. Some physiological measurements in patients with severe illness would be far normal, that is, some physiological measurements would be found to have largely deviated to levels above or below the normal range. As the severity of illness is increased, the PK of the drug would be affected which could lead to non-linear relationships. This suggests that the PK in patients with severe illness could not be predicted based on linear relationships between physiological measurements and plasma levels. The performance of prediction for both ANN and MLRA generally increases with increasing the size of the data sets. However, an ANN would have some advantages over a MLRA, because of the ability of the ANN to more easily handle the non-linear relationship between each physiological measurement and plasma level of drug. The mean values for the physiological parameter of 30 patients were within the normal range. However, each patient had some, usually more than 1, abnormal physiolocal parameter. We expect that the data laying outside of normal range would affect the pharmacokinetic behavior of ABK, possibly by non-linear relationship between the measured parameters. In ANN prediction, the performance in prediction of plasma levels using standardized data sets was better than using intact physiological measurements. ANN prediction using standardized data sets resulted in reasonable prediction of the PK of ABK in patients with severe illness, suggesting that the standardization of input data is effective for increasing predictive performance. i.e. sigmoid transfer function varies 011. Since intact physiological measurements show a variety of ranges of numerical values, as seen in Table I, the weight between neurons would be difficult to optimize by ANN. Use of standardized input data is important for a more precise prediction by ANN.Conclusion In many patients hospitalized in an ICU, the prognoses are strongly dependent on the successful implementation of drug therapy for the treatment of contracted infections. For these patients, knowledge of the patient specific PK of ABK is very important for drug therapy. Therefore, we applied an ANN simulator to predict the PK of ABK using physiological measurements in patients with severe illness. ANN analysis using standardized data showed reasonable predictive performance. Our findings demonstrate that an ANN is a powerful technique to optimize non-linear phenomena. The ANN has some advantages over standard statistical methods, as it can recognize complex relationships in the data without them having to be explicitly included in the analysis.References Corresponding author: Shigeo Yamamura, Ph.d., School of Pharmaceutical Sciences, Toho University, Miyama 2-2-1, Funabashi Chiba 274-8510, Japan, email:yamamura@phar.toho-u.ac.jp Keywords: artificial neural network, prediction of plasma level, aminoglycoside antibiotic, non-linear prediction. Abbreviations: ANN, artificial neural network; MLRA, multiple linear regression analysis, ABK, arbekacin sulfate; PK, pharmacokinetic; PD, pharmacodynamic. CRP, C-reactive protein; APATCH, acute physiology and chronic health evaluation. ICU, intensive care unit. MRSA, methicillin-resistant Staphylococcus aureus
Published by the Canadian Society for Pharmaceutical Sciences. Copyright © 1998 by the Canadian Society for Pharmaceutical Sciences. |