Step 1 ñ Obtain Data Files.
Accessing the climate and harvest data occurred quickly but the sea ice data were slow coming in. It was late October before the sea ice files were received.
Step 2 ñ Clean Harvest Data.
The harvest data included many fields of information not applicable for this project and had a significant amount of data missing. I spent several days getting to know the database codes, contents of the database, deleting and sorting files. I whittled the number of records from 4,500 to 1,755.
Step 3 ñ Code Data According to the Study Year: October ñ May.
The calendar year was not used as it does not reflect the reality of sea ice development and melt, nor, the approach used by agencies managing polar bear harvest. The sea ice year begins in October and ends in June. The harvest year begins in July and ends in June. Thus, each year is describe in this format, 1979-1980, and represents the period from October 1979-May 1980.
Step 4 ñ Import Harvest, Sea Ice and Climate Datasets into GIS.
All data were imported into GIS using ArcGIS 9.1 software to create new datasets which were exported for analyses. The sea ice data was particularly challenging task. Andreas Hamann completed the transformation and import of the sea ice and climate data. I dealt with the import of harvest data. Jason Young, GIS technical support, Department of Biological Sciences helped me with my many questions about using ArcGIS.
Step 5 ñ Create Map Coverages
Community (point file) ñ one file with all communities and one file for each community to use for buffers and distance measurements
Harvest (point file) ñ one file with harvest data for all years and one file with harvest data by community
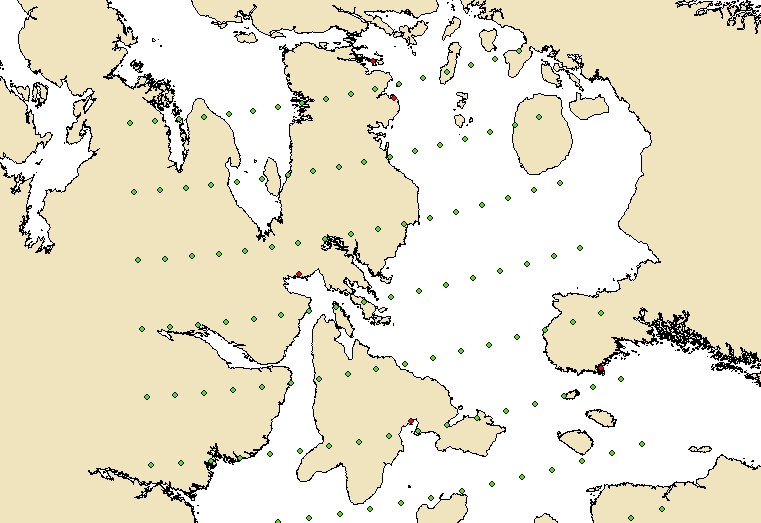
Sea ice (point file) ñ sea ice data for all years; the attribute table for each point contained all data for all years for that location
Climate (point file) ñ climate data all years; the attribute table for each point contained all variables for each year for that location
Step 6 ñ Create New Datasets in GIS.
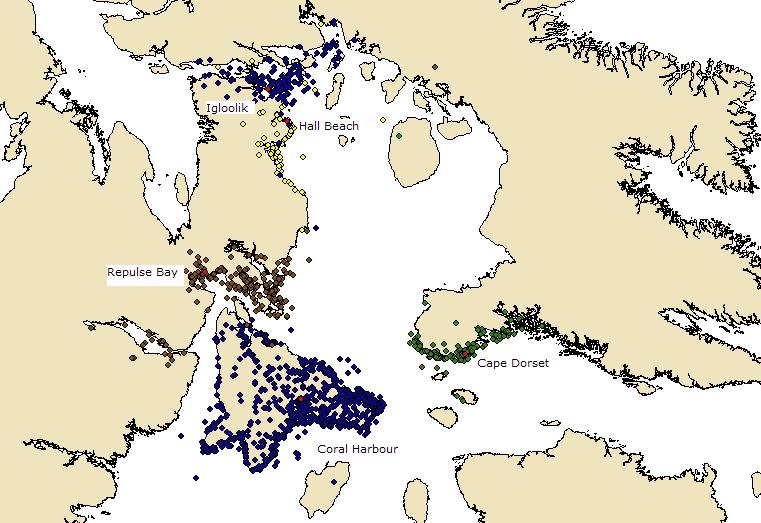
Final Harvest Data
The harvest dataset was further refined when the harvest was overlaid on sea ice with community. The extent of the sea ice coverage did not include the harvest by Chesterfield Inlet, Kimmirut and the communities in northern Quebec. The final harvest dataset was reduced to: Coral Harbour, Repulse Bay, Hall Beach, Igloolik, and Cape Dorset.
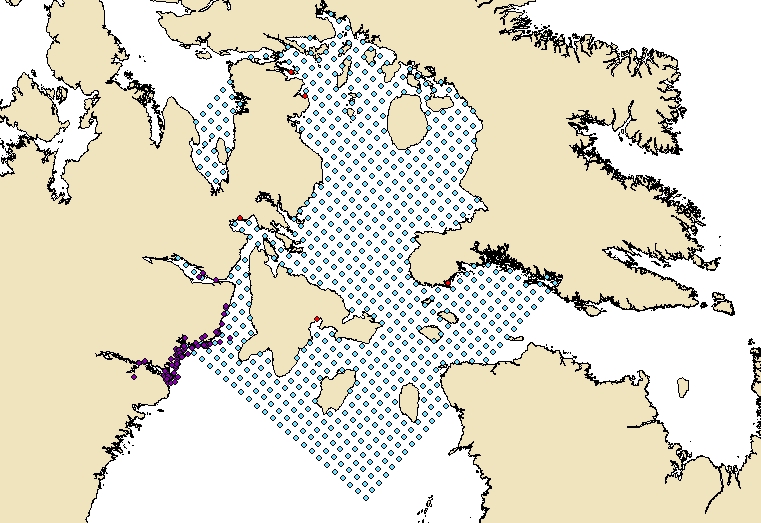
Distance Travelled by Hunters From Home Community to Kill Sites
To calculate the distance travelled by hunters to the location where they killed a polar bear two map coverages were used: individual community and harvest by community. The ArcGIS Proximity Tool was used to measure how far a hunter had to travel to kill a polar bear. The resulting data file was exported into Excel. In Excel the average distances travelled by year and month was calculated. The data was then summarized into the average distance travelled by year and season for each community.
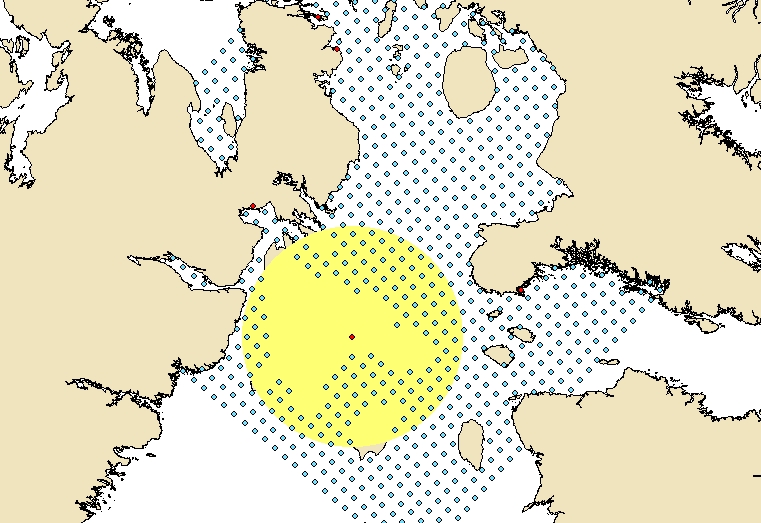
Sea Ice Conditions Experienced by Hunters and Polar Bears
To calculate the sea ice conditions two coverages were used: community and sea ice. A 100 and 200 kilometre buffer was created around each community using the ArcGIS Buffer Tool. The maximum buffer size (200) was defined by the maximum distance travelled by hunters in each community. No hunter travelled more than 200 kilometres. The sea ice data for each point falling within a buffer was extracted and exported into Excel. The average monthly and annual sea ice condition were calculated. The data was then summarized into the average annual and seasonal sea ice conditions.
Community Climate
To calculate the climate conditions two coverages were used: community and climate. The nearest point to each community that was located on the sea was selected and the climate data extracted for that point and exported into Excel. Igloolik and Hall Beach share the same climate information due to close proximity. The average monthly mean temperature, average monthly maximum temperature, average minimum temperature and average mean precipitation for the entire time period were calculated. The data was then summarized into the average annual and seasonal mean temperature and precipitation.
Step 7 ñ Discoveries in the Data & Additional Grouping
I had assumed, from my experience living in the Baffin Region of Nunavut, that polar bear hunting activity would be focused during the spring period. But as I mapped and graphed the harvest data it was clear that fall was the most important polar bear hunting season in Foxe Basin.
The three data sets (harvest, sea ice, climate) were recoded and regrouped from three seasons (fall, winter, spring) to two seasons (fall, winter/spring). The months of each season became: fall (October, November, December) and winter/spring (January, February, March, April, May). Fall corresponding to the freeze up period with variable ice conditions and winter/spring to the period of stable ice conditions and close to 100% ice coverage.