Legend: Red - Known Early Successional Species Blue - Known Mid Successional Species Green - Known Late Sucessional Species

Legend: Red - Known Early Successional Species Blue - Known Mid Successional Species Green - Known Late Sucessional Species

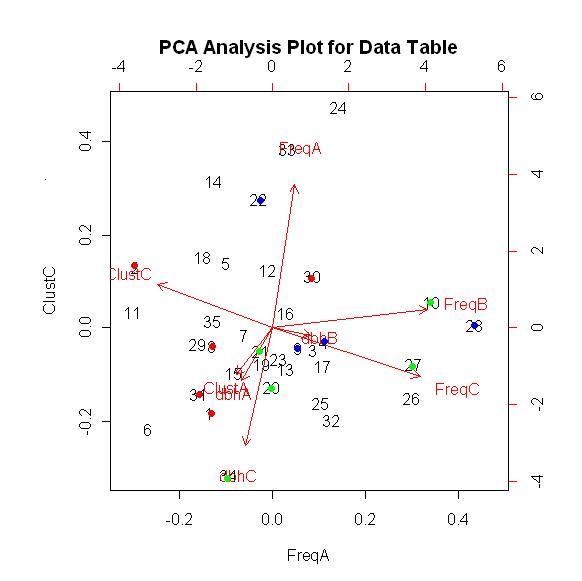
The top image (FIGURE 10) shows that the
early successional species group together based on the clustering values in both the Young Growth stand (PLOTA) and
the Old Growth stand (PLOTC) and the slope of the dbh distribution in the Young Growth stand (PLOTA). The distinction
between mid and late successional species is suggested, but less defined. Speices 30 (TABUYONG) is an known early
successional species that lies outside the clustering of the other known early successional species. This can be
explained since Tabuyog has
almost a 50% higher frequency then the species with the second highest frequency in the Young Growth stand (PLOTA).
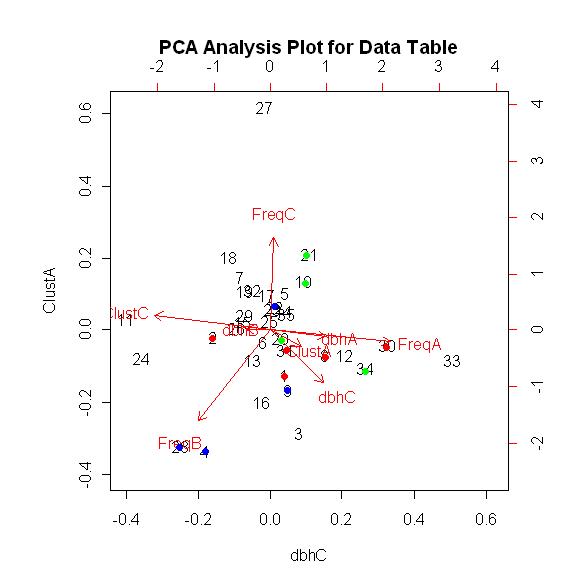
FIGURE 11 shows the same PCA analysis as in
FIGURE 10, but values are plotted based on the clustering values in the Young Growth stand (PLOTA) and the slope of
the dbh distribution in the Old Growth stand (PLOTC). By changing the values that are plotted in the PCA biplot the
direction of the frequency and slope of the dbh distribution in the Young Growth stand vectors overlay one another
and as a result pulls Tabuyog into the early successional grouping.
Back to
MULTIVARIATE RESULTS & DISCUSSION
page.