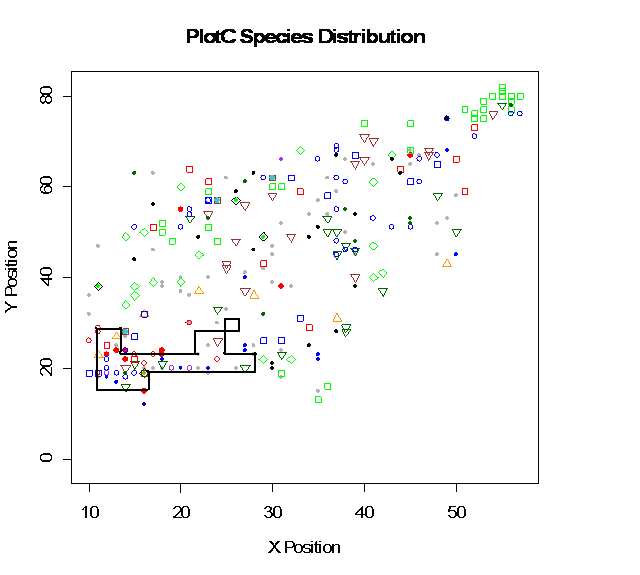
Black border indicates dissimilarity limit, therefore subplots within the border are similar. Image generated in R
Back to PRILIMINARY ANALYSIS page.