If you you want to select another target site, use the drop-down menu above or return to the home page: https://tinyurl.com/diverse-sst
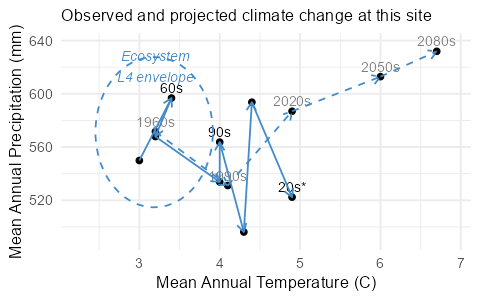
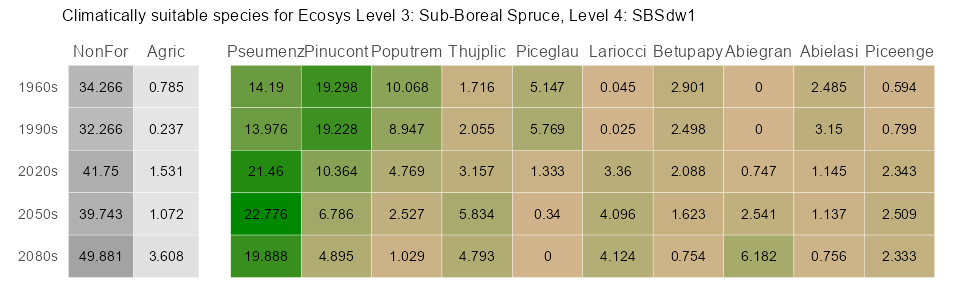
The need for assisted migration depends on the magnitude of observed and projected climate change. The left plot shows climate change in consecutive decadal time steps (solid arrows, black markers) and consecutive 30-year averages (dashed arrows, gray markers). The underlying data are climate records observed at weather stations from 1951 to 2024 (50s = 1951-1960 mean, 20s* = 2021-2024 mean), and CMIP6 multimodel projections thereafter (2020s, 2050s, 2080s), corresponding to the sliders next to the map below. The table (right) lists projected habitat suitability for common tree species (in % of land base). You can download a table for this site with all potential species choices for reforestation in the future, as well as guidelines for interpretation.
|
|
|
Once you have decided on suitable species, select the appropriate seed sources. Usually, you should not use seed sources local to the site. Move right sliders towards left to filter for seedsources from level-4 ecosystems with a good climate and soil match (values <0.5) or reasonable match (values 0.5-1.0). Slider scales starting at values >1.0 approach no-analogue conditions in the future for climate, or a poor regional match in soil characteristics. Click on one of the remaining markers and select View to see how the target ecosystem may look like, when in equilibrium with future climate (note: you may see an urban or agricultural area - this will be curated in the future). You can also pan and zoom (mouse wheel and drag) to see the target FMA (light gray) and specified planting zone (dark gray), around the blue marker.
The table below lists the top-10 frequent tree species as potential seed sources. The table updates dynamically as you move the sliders. You can sort rows by climate distance (scroll to the right for climate distance variables, e.g., cd2080s. Lower numbers are a better match). You can also click on a table row to highlight seed source on the map. Keep in mind that climate matching and approximate soil matching at the ecosystem level is just that. For successful reforestation under specific site condition refer to species' silvics or local reforestation manuals. Species still need to be matched to appropriate site types equivalent to where they occur in their origin ecosystem.