|
|
Ch E 416 - Assignment 7
Solutions
(1) Minimum
Reflux
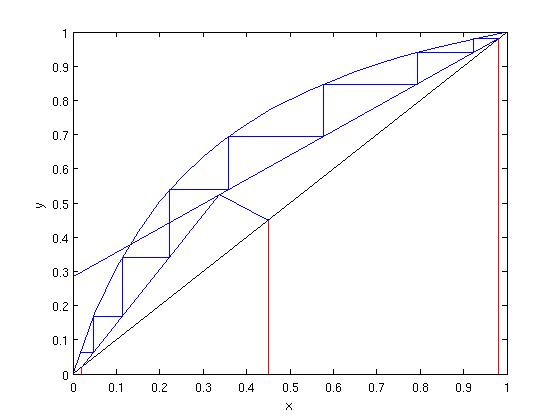
Equilibrium line :
q – line:
Equilibrium stages required, N=8 Number of trays = 8 – 1 = 7 The MATLAB file McCabeT.m was used to generate the
above graph. (2) Cooling and
heating duties
Where, x1 and y1
are the compositions of the liquid and vapour in the reboiler (passing
streams)
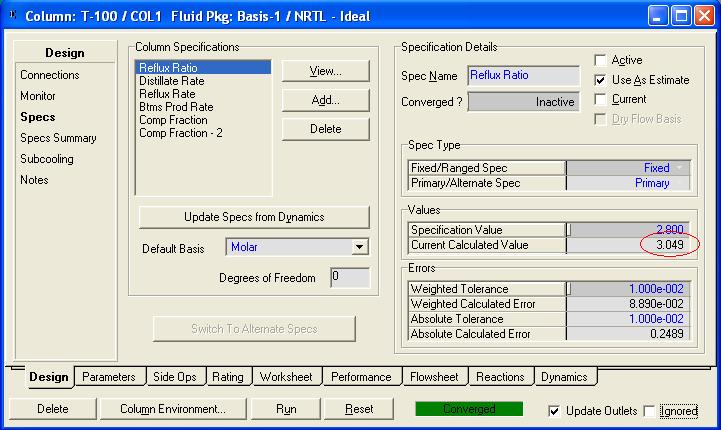
(3) Cooling and heating duties using HYSYS
The simulation case is COL1.HSC
Note that the main difference
is in the condenser duty. Remember that the graphical method was derived from
assumptions as constant volatility model, constant molar flow rate and
constant heat of vaporization.
From the figure, it is clear
that to reach the purity specifications, the rigorous simulation produces a
different reflux ratio, slightly higher than the 2.4424 calculated in part 1.
As a consequence, more material is being condensed. Hence, the heat duty is
higher. (4) Modified column with a reboiler substitution
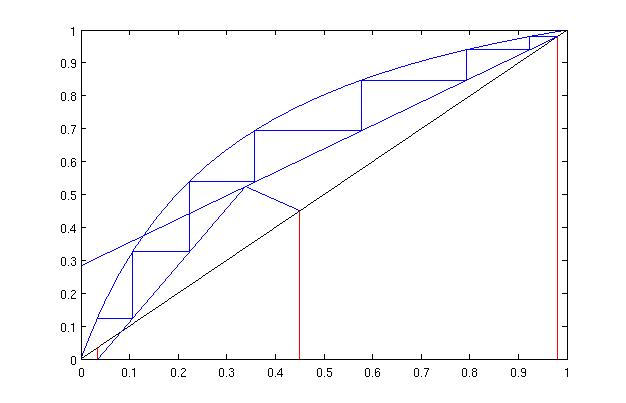
(5) Murphree efficiency of 75%
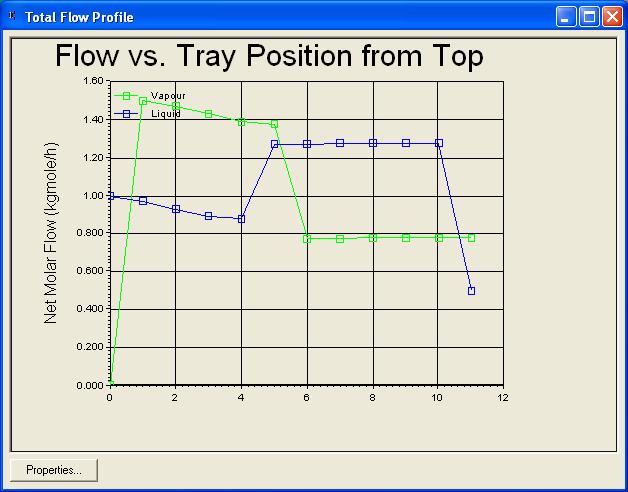
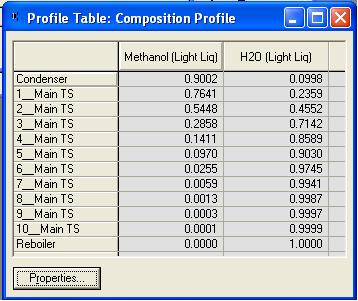
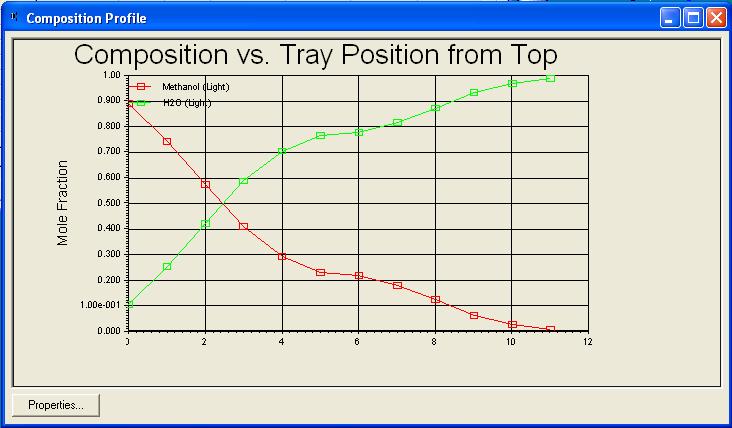
Equilibrium stages required, N=11 Number of trays = 11 – 1 = 10 (6) HYSYS simulation
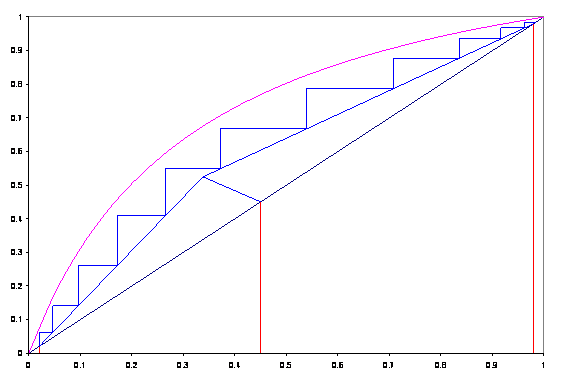
The
simulation case is Col.HSC
Notice the differences from the CMO assumption especially in the enriching
section. Also, notice the degree of separation water – methanol in the
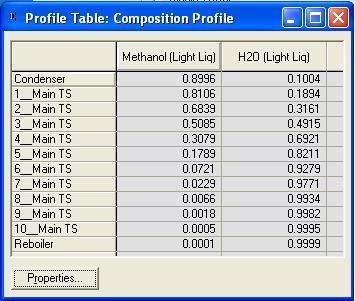
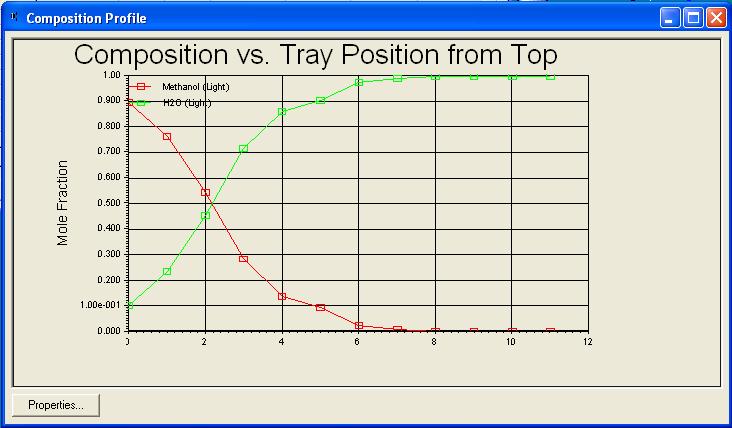
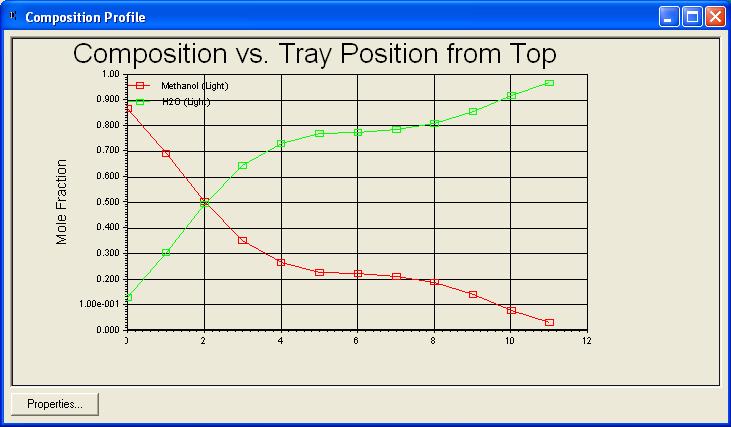
bottoms product. (7) HYSYS simulation changing efficiencies:
As expected, the separation is less effective as the efficiency
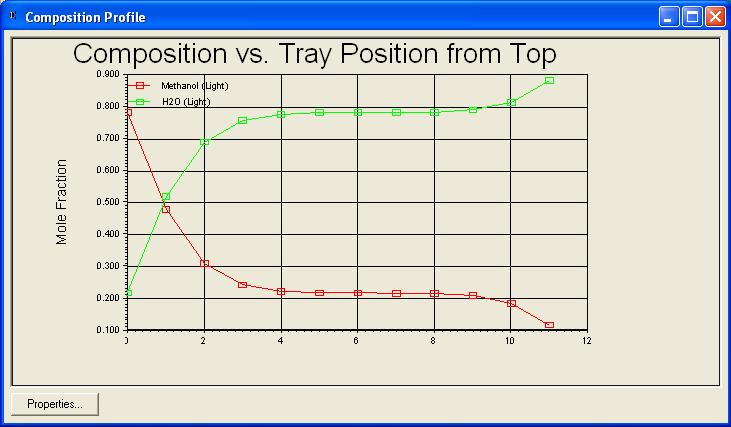
decreases. (8) HYSYS simulation changing reflux ratio:
Taking the simulation from
part 7, the reflux ratio was decreased from the value of 2. The following
plots show the “pinch – like condition”. R=2.0
R=0.9
Notice
the plateau that starts to appear near the feed stage R=0.8
R=0.5
At this
point, no changes in composition take place after the feed stage. In
distillation of near ideal binary mixtures, the pinch condition is always at
the feed tray Posted November 12, 2006 |