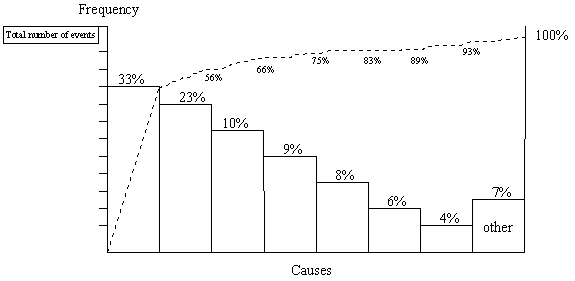
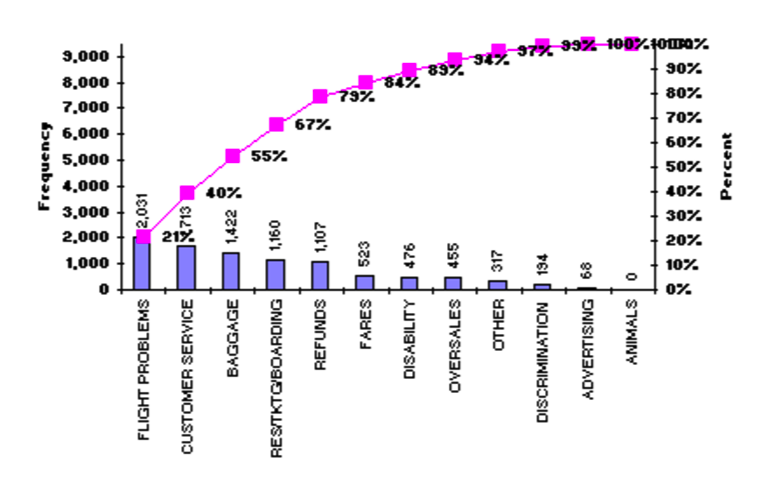
1. Use a check sheet or "brainstorm" to obtain data.
2. Arrange
the data in order from the largest category to the smallest.
3. Calculate
the total.
4. Compute
the percentage of the total that each category represents.
5. Compute
the cumulative percentage.
6. Scale the
vertical axis for frequencies (zero to total).
7.
From left to right, construct a bar for each category, with height
indicating the frequency. Start with the largest category and add them
in descending order (combine the categories containing the fewest items
into an "other" category and put it on the extreme right, as the last
bar).
8. Draw a
vertical scale on the right and add a percentage (0 to 100 percent
scale).
9. Plot a
cumulative-percentage line.
10. The most
frequent event is not always the most important. Always ask: What has the most impact on the goals of our business
and customers?

